
What Is Normal Distribution And Why It So Important In Statistics?
A normal distribution is continuous probability distribution and has a bell shaped curve. They are used to represent real world random values because when we plot distributions of real world data such as heights of the people in a country then such kinds of distributions are rarely normal. They are either right skewed or left skewed. Central Limit Theorem is then used to draw the sampling distribution (which is nearly normal) to estimate the population parameter.
Normal distributions makes the life easier as we can easily apply z-scores to Standard Normal Distribution with mean=0 and standard deviation=1 to find the confidence intervals and hypothesis testing.
Properties of Normal Distribution
- They have mean=median
- They are symmetrical about its mean
- They are unimodal i.e having one prominent peak
- It is completely determined by two parameters i.e mean and standard deviation
68–95–99.7% Rule
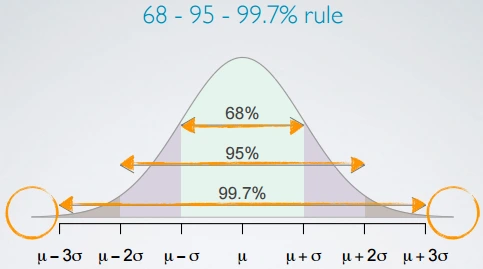
For a Normal Distribution
- 68% of the data falls within one standard deviation
- 95% of the data falls within two standard deviation
- 99.7% of the data falls within three standard deviation
Example
Suppose the SAT scores are nearly normally distributed with mean=1500 and standard deviation=200, then
- 65% of the students will have their SAT scores within one standard deviation of the mean. 65% of the students will have their SAT scores within the range mean±standard deviation i.e 1500 ± 200 = (1300,1700)
- 95% of the students will have their SAT scores within two standard deviation of the mean. 95% of the students will have their SAT scores within the range mean ± 2*standard deviation i.e 1500 ± 2*200 = (1100,1900)
- 65% of the students will have their SAT scores within one standard deviation of the mean. 99.7% of the students will have their SAT scores within the range mean ± 3*standard deviation i.e 1500 ± 3*200 = (900,2100)
One thing is worth noticing here that as we are increasing the percentage of the students in the some range the respective range is also increasing because as the number of the students increases the variability around the mean also increases.
Food For Thought
65, 95, 99.7 % rule can also be used to determine the outliers if the distribution is nearly normal. Observation residing outside the 2*standard deviations of the mean can be encountered as unusual.
Standardized Scores (Z-Scores)
Lets start with an example;
Lets say you are a college admissions officer and want to determine that which of the two applicants scored better on their standardized test with respect to the other test takers: Imran who earned 1800 on his SAT or Hasan who scored a 24 on his ACT? Suppose that SAT and ACT scores are normally distributed with mean=1500,SD=300 and mean=21,SD=5 respectively.
You cannot say that Imran scored better since there scores are different scales (quiet obvious 🙂 ).
Here we are interested that how many standard deviations above the respective means of their distributions Imran and Hasan scored. Here is how we can do it:
- Imran: 1800–1500/300=1
- Hasan: 24–21/5= 0.6
- Imran is 1 standard deviation about the mean of the distribution of SAT scores.
- Hasan is 0.6 standard deviation above the mean of the distribution of ACT scores.
Therefore we can conclude that Imran did better than Hasan. What we just did is called calculating Z scores.
What is Z-Score Standardization?
Standardized (Z) Score of an observation is the number of standard deviation it falls above or below the mean.
Z = observation-mean/standard_deviation
Few things worth noting:
- Z score of mean=0 (see the formula of Z score)
- |Z|>2 can be encountered as unusual
Probabilities And Percentiles
Percentile is the percentage of observations that fall below a given data point.
Graphically percentile is the area below the probability distribution curve to the left of the observation.
Food For Thought
Why we just calculate the z scores for the normal distribution?
The answer is to calculate the z scores for other distributions we need calculus. To find the area below the given point under the probability distribution (Yes integration leave it xD)
Computing Percentile From Standard Normal Table
Standard normal table has the values for the probability distribution having mean=0 and standard deviation=1
Example
Lets take the previous example again
Suppose that the SAT scores are uniformly distributed with mean =1500 and standard deviation=300. Hasan scored 1700 on his SAT score. What percentage of the students scored below than Hasan?
First calculate the z score for our observation i.e Hasan’s score
z=1700–1500/300=0.66
Lets find this z = 0.66 in our standard normal table:
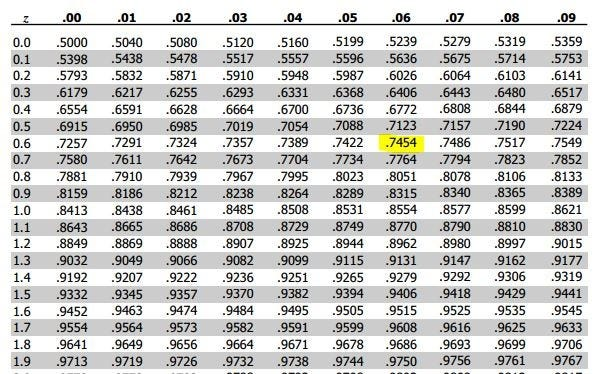
We get a value of 0.7454 so it means that 74.54% of the students scored below than Hasan i.e p(Z<0.66) = 0.7454. It also implies that 1–0.7454 = 0.2546 = 25.46% of the students scored greater than Hasan.
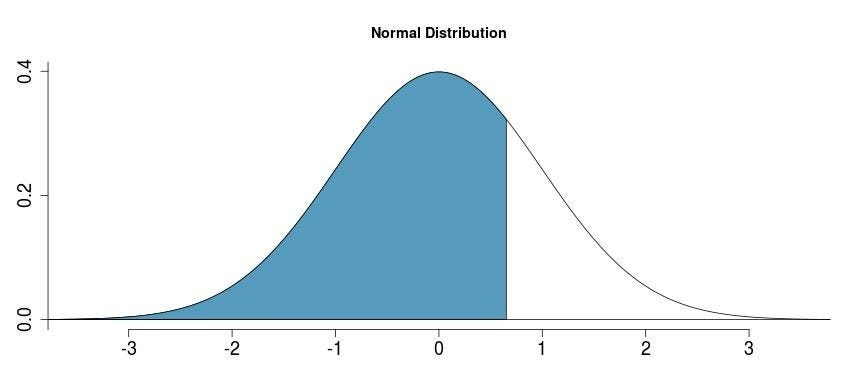
The shaded area in the above figure represent the percentage of the students scored below than hasan i.e 74.54%
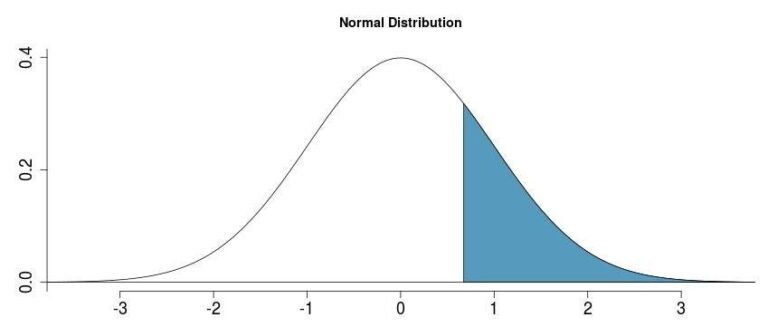
The shaded area in the above figure represent the percentage of the students who scored greater than hasan i.e 25.46%
Calculating Z Scores And Percentiles In Python
Certainly! Here's a more intuitive version:
Calculating Z-scores and percentiles in Python is quite straightforward.
For example, if we calculate a Z-score in Python, we might get 0.745, which matches what we find in the standard normal table.
We can also determine the value of an observation if we know the percentage of the distribution below it. For instance, to find the Z-score of 0.66 (which we calculated earlier), we use 0.745 with st.norm.ppf, representing the percentage of people below our observed value.
In conclusion, understanding the normal distribution and its properties is essential for anyone delving into data science and statistics. The ability to calculate and interpret Z-scores and percentiles allows us to make informed decisions and draw meaningful insights from data. By mastering these foundational concepts, you will be well-equipped to tackle more complex analytical challenges and enhance your statistical acumen.